Dashboard
The dashboard is the main hub for managing your platform. It provides a comprehensive overview of your business metrics, transactions, and user activity.
Dashboard Overview
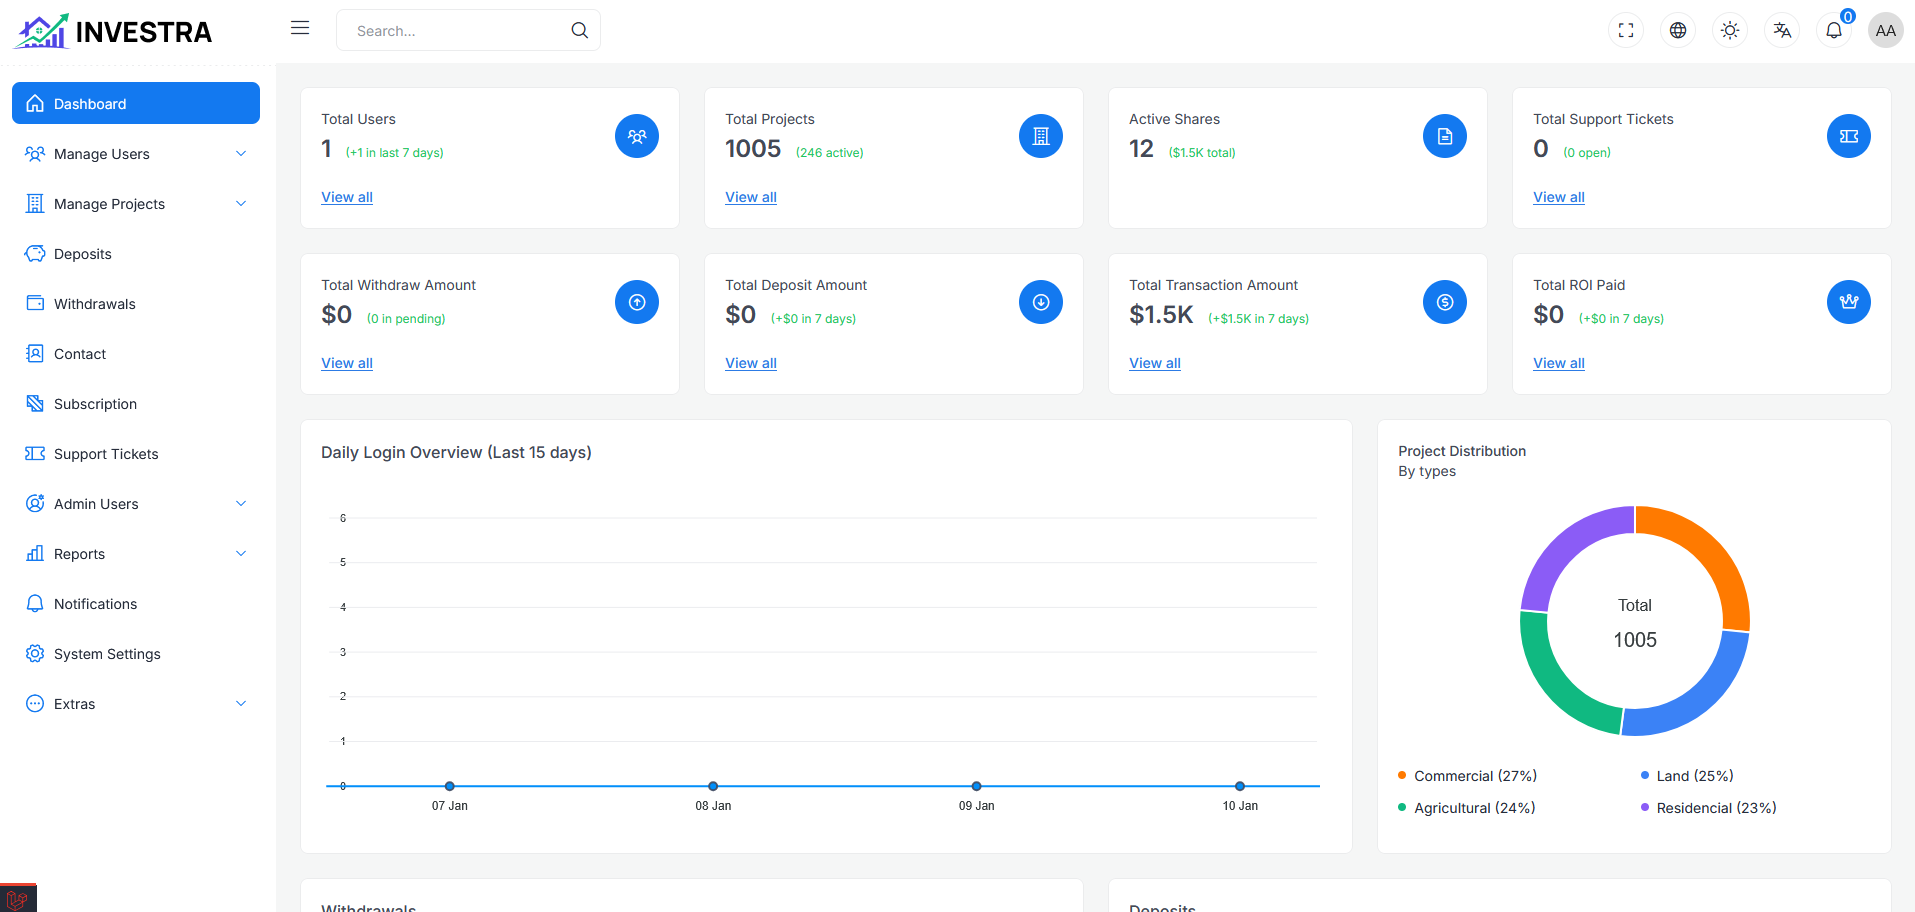
The dashboard page provides a quick overview of key platform metrics at a glance.
Statistics Cards
The top section displays key statistics:
First Row
- Total Users: Total number of registered users
- Total Projects: Total number of projects on the platform
- Active Shares: Total number of active shares with value
- Total Support Tickets: Number of support tickets
Second Row
- Total Withdraw Amount: Total amount of all withdrawals
- Total Deposit Amount: Total amount of all deposits
- Total Transaction Amount: Combined transaction value
- Total ROI Paid: Total returns distributed to investors
Each card includes a View all link for detailed information.
Daily Login Overview
The Daily Login Overview (Last 15 days) chart shows user login activity over time. This helps track user engagement patterns across your platform.
Project Distribution
The Project Distribution By Types donut chart displays the breakdown of projects by category:
- Commercial: Commercial property investments
- Land: Land investment projects
- Agricultural: Agricultural property investments
- Residential: Residential property investments
The chart shows each category's percentage of total projects, helping administrators understand the portfolio composition.
Investment Analytics
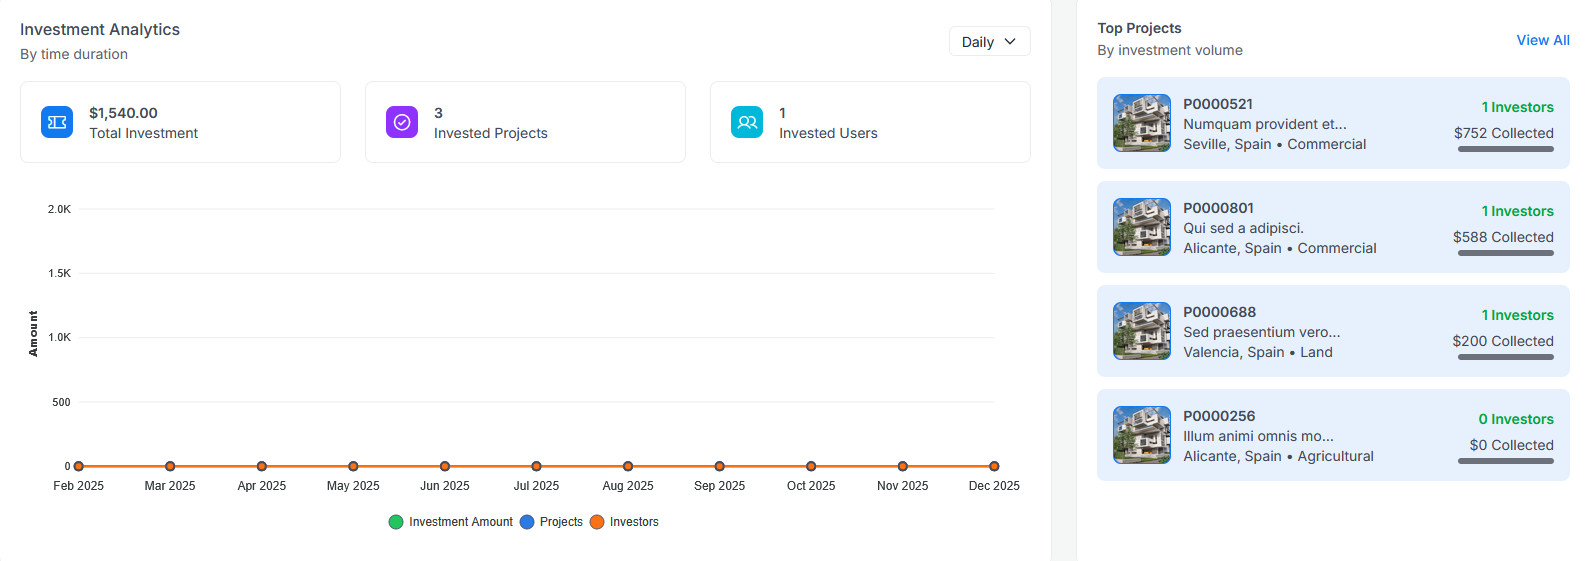
The Investment Analytics section provides insights into investment activity over time:
- Total Investment: Combined value of all investments
- Invested Projects: Number of projects that have received investments
- Invested Users: Number of users who have made investments
The chart displays trends for:
- Investment Amount
- Projects
- Investors
You can filter the data by time duration (Daily, Weekly, Monthly, Yearly).
Top Projects
The Top Projects section displays projects ranked by investment volume:
- Project ID and name
- Location and property type
- Number of investors
- Amount collected
Click View All to see the complete list of projects.
Top Investors
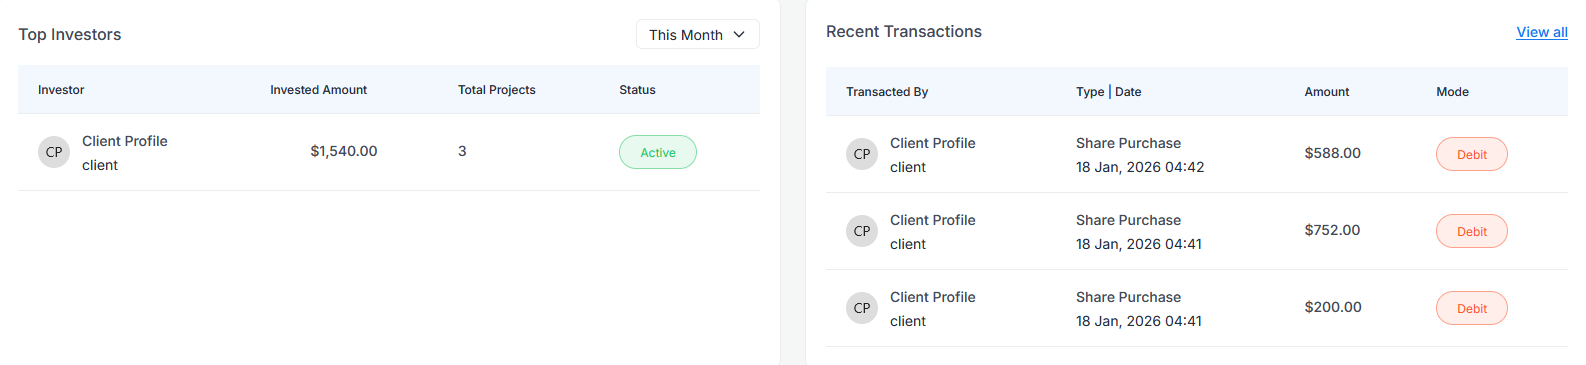
The Top Investors table displays the most active investors:
- Investor: Name and profile
- Invested Amount: Total amount invested
- Total Projects: Number of projects invested in
- Status: Active/Inactive status
You can filter by time period (This Month, This Year, etc.).
Recent Transactions
The Recent Transactions section shows the latest transaction activity:
- Transacted By: User who made the transaction
- Type | Date: Transaction type and timestamp
- Amount: Transaction value
- Mode: Debit/Credit indicator
Click View all for the complete transaction history.
Login Analytics
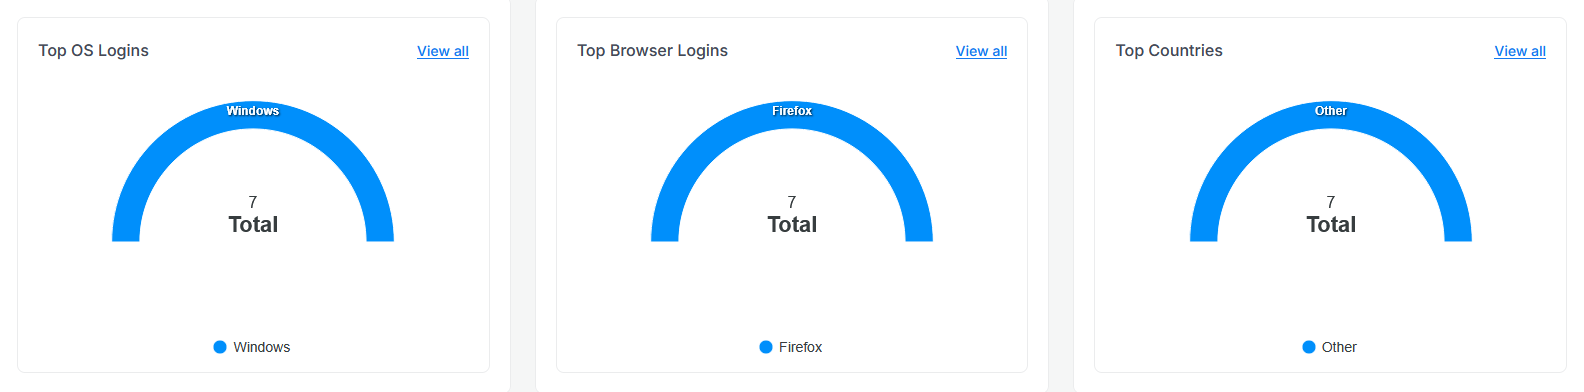
Top OS Logins
A gauge chart showing the distribution of user logins by operating system:
- Windows
- Linux
- AndroidOS
- OS X
Top Browser Logins
A gauge chart showing the distribution of user logins by browser:
- Firefox
- Chrome
- Safari
- Edge
Top Countries
A gauge chart showing the distribution of user logins by country, helping identify your platform's geographic user base.
Each chart includes a View all link for detailed analytics.